Safe Speed Forums

The campaign for genuine road safety
It is currently Tue Oct 28, 2025 10:54

All times are UTC [ DST ]


Post new topic Reply to topic  [ 48 posts ]  Go to page 1, 2, 3  Next
Author Message
 Post subject: Stats & cameras
PostPosted: Sun Nov 05, 2006 03:29 
Offline
User

Joined: Tue Oct 10, 2006 22:57
Posts: 261
{RP - On request - and I agree wholeheartedly - I have split this from the PCSO spat in "Help I'm being prosecuted"}

I understand I may be going against the grain on this website, BUT..

I have just posted a few interesting links to success stories behind speed reducing initiatives, such as Mounted cameras, Lasers etc.

http://www.whatcar.co.uk/news-article.aspx?NA=217532


http://news.bbc.co.uk/1/hi/england/2778143.stm

“The partnership said its figures showed the use of speed cameras had resulted in less fatalities and 265 fewer injuries.”

http://www.transport2000.org.uk/news/ma ... icleID=172


“TRANSPORT 2000 today warmly welcomed the latest results of the Safety Camera Partnerships. With the partnerships recording a 40 per cent average reduction in people being killed and seriously injured at camera sites across the country, Transport 2000 welcomed the fact that over 100 lives had been saved in 2002-03 as a result of speed cameras. (1)”


http://www.749.supanet.com/cameras.htm

“Painting the camera cost just £250 - but in a few months accidents on the road resulting in death, serious injury or slight injury have fallen by 43%, almost three times the figure claimed in Northamptonshire, and, crucially, that has been achieved by actually reducing the number of tickets issued. Offenders on that stretch of road fell dramatically from 19.2 per day in March 2000 to 3.8 per day in August 2000 – 80% down.”

http://www.londonspeedcameras.com/faqs.asp
“Are cameras installed to generate revenue?
No.

The success of the LSCP is NOT measured by the amount of revenue collected. Some of the revenue is claimed back by the LSCP to fund operational costs, publicity and road safety education. All of the remaining revenue is retained by the Treasury. We measure our success in terms of casualty reduction. Falling revenue means that motorists are slowing down and that we have achieved safety benefits.”

http://www.bbc.co.uk/shropshire/content ... ture.shtml
“In a bid to avoid accusations that speed cameras are another way of raising money from motorists, the locations of the mobile cameras are published.
The West Mercia Safety Camera website lists fixed camera locations by county. It also has an up-to-date list of all sites used by the mobile cameras as well as a reminder of the speed limit at each location.”
http://www.tfl.gov.uk/streets/lscp/came ... tory.shtml
“Fatal collisions showed an overall reduction from 62 in the before period (3 years) to 19 for the same period after, a decrease of 69.4%. Overall, the results showed that, whilst the introduction of cameras resulted in significant reductions in total collisions, they are shown to have been most effective in reducing the specifically targeted higher severity collisions.”
http://feeds.britainnews.net/?rid=39242 ... c72160&f=1
“The cameras record the number plates of speeding drivers and flash them up on a screen but do not issue penalties.
They were used during June along a stretch of the M42 in the West Midlands and proved a success with nearly half of speeding drivers slowing down. “
“She said the fact that the cameras did not issue fines showed they were not only "revenue raisers" as portrayed by newspapers.”
http://www.slower-speeds.org.uk/ks-sum.htm
“Speed is the biggest single factor in road crashes, responsible for over 1,000 deaths and 10,000 serious injuries in Britain every year. Controlling speeds at appropriate levels is the most significant action that local authorities can take to reduce casualties on Britain's roads.”
“First amongst these is casualty reduction. Every 1mph reduction in average speeds brings a 5% reduction in the number of crashes, and hence in the number of people killed or injured on the roads. This means that even marginal”

Before people argue that the success is down to figures of person’s caught speeding, I would class success as fewer accidents and injuries, fatalities on the stretches of road these cameras cover. (Which is significant as the links would suggest).
Some have suggested these cameras be painted indigo and bright high visibility Colours, I agree and more and more forces are doing it, whatever brings accidents and deaths down on our roads.


There are many arguments for and against the use of lasers and cameras, but less fatalities on the road’s these things are based, has to be a positive??

Ok here is my last Link and ow my god have I saved the best till last, this is the scientific approach to testing the effectiveness, not Highways agency propaganda as some may hesitantly suggest.
I have book marked this link and good god he’s a genius, even takes a poke at Safe Speed.

http://www.ex-parrot.com/~chris/wwwitte ... ument.html

“It tells us that one argument used against them -- by the ABD, and Idris Francis and other assorted loons from the `Safe Speed' campaign -- is b@@ocks. (As are most of their other arguments, but this post is already too long; the other arguments are mostly handwaving anyway, and can be dismissed without needing to resort to anything like the above, either because they are nonsense or because there isn't any data to confirm them. Another day, perhaps, if these bozos irritate me any more.”
:wink:
This guy is my new hero, anyway just wanted to show, there are people out there (like myself) who believe there is good reason for enforcing the speed laws.

Just my two pence worth.


Last edited by **Mike** on Sun Nov 05, 2006 04:36, edited 1 time in total.

Top
 Profile Send private message  
 
 Post subject:
PostPosted: Sun Nov 05, 2006 05:13 
Offline
Friend of Safe Speed

Joined: Sat Mar 06, 2004 12:01
Posts: 4813
Location: Essex
Quote:
I have just posted a few interesting links to success stories behind speed reducing initiatives

I have yet to follow these links, but I will do so in the coming days (at least some of them).

Are they successful in reducing speeds or reducing accident count and/or severities? I am guessing the former by stats and, if the latter, by RTTM.


Top
 Profile Send private message  
 
 Post subject:
PostPosted: Sun Nov 05, 2006 05:49 
Offline
User

Joined: Tue Oct 10, 2006 22:57
Posts: 261
Roger wrote:
Quote:
I have just posted a few interesting links to success stories behind speed reducing initiatives

I have yet to follow these links, but I will do so in the coming days (at least some of them).

Are they successful in reducing speeds or reducing accident count and/or severities? I am guessing the former by stats and, if the latter, by RTTM.


Hi Roger, I think you’ll find most of them are regarding the reduction of collisions/accidents, fatalities and injuries.

I’m sure there have been many debates on here before regarding the pros and cons of these initiatives, but I thought the last link was especially informative.

It’s just a different take on things.


Top
 Profile Send private message  
 
 Post subject:
PostPosted: Sun Nov 05, 2006 12:46 
Offline
Friend of Safe Speed
User avatar

Joined: Sun Sep 25, 2005 10:16
Posts: 7986
Location: Moved to London
http://www.whatcar.co.uk/news-article.aspx?NA=217532
Says loads about violations, but nothing about reducing crashes at all.


http://news.bbc.co.uk/1/hi/england/2778143.stm
Too vague to draw any conclusions (the only real figure shown is that raked in from the fines)

http://www.transport2000.org.uk/news/ma ... icleID=172
Quote:
With the partnerships recording a 40 per cent average reduction in people being killed and seriously injured at camera sites across the country.

RTTM

http://www.749.supanet.com/cameras.htm
That page was created nearly 7 years ago. Public support has since evaporated and no fatality trend has been observed. Also, it’s a personal webpage so any info could well have been cherry-picked.

Quote:
In a victory for common sense Home Secretary David Blunkett decided in 2001 that any new cameras that are put up should be only at known accident sites and made more visible.

RTTM

http://www.londonspeedcameras.com/faqs.asp

Quote:
“Are cameras installed to generate revenue?
No.

Well of course they would say that!

http://www.bbc.co.uk/shropshire/content ... ture.shtml

Quote:
“our speed cams are not hidden………”

Look at the image on that page, tell me what you see wrong:

Image

http://www.tfl.gov.uk/streets/lscp/came ... tory.shtml
Quote:
“Fatal collisions showed an overall reduction from 62 in the before period (3 years) to 19 for the same period after,”

This is so obviously at the camera site – RTTM

http://feeds.britainnews.net/?rid=39242 ... c72160&f=1
Said plenty about drivers slowing down, or should I say panic braking, but it didn’t say anything about reduction of crashes/casualties.

http://www.slower-speeds.org.uk/ks-sum.htm
Quote:
“Speed is the biggest single factor in road crashes, responsible for over 1,000 deaths”

Ah, the 1/3 lie. Our own government’s very recent figures have shown this to be very much the lie. Quoth DfT 2006-11-05 (dft_transstats_612594)

“Failed to look properly was the most frequently reported contributory factor and was involved in 32 per cent of all accidents. Five of the six most frequently reported contributory factors were some kind of driver or rider error or reaction. For fatal accidents the most frequently reported contributory factor was loss of control, which was involved in 35 per cent of fatal accidents.”

Where did it say “speed”? Oh wait, it's much later on!

“Exceeding the speed limit was reported as a contributory factor in 5 per cent of all accidents.”

DING!


http://www.ex-parrot.com/~chris/wwwitte ... ument.html
“The anti-speed-camera campaigners are liars, and innumerate too.”

Yeah, obviously!!! See the previous comment.
Oh, the genius forgot other measures applied at speed camera sites (you can't tell me there were none)


Top
 Profile Send private message  
 
 Post subject:
PostPosted: Sun Nov 05, 2006 13:05 
Offline
Friend of Safe Speed
User avatar

Joined: Sun Sep 25, 2005 10:16
Posts: 7986
Location: Moved to London
**Mike** wrote:
I have book marked this link and good god he’s a genius, even takes a poke at Safe Speed.

http://www.ex-parrot.com/~chris/wwwitte ... ument.html

In case you are wondering what all the RTTM hubbub is about, this explanation is from the same website:

http://ex-parrot.com/~pete/notverygoodatstatistics.html
(let's not forget he "likes speed cameras" )

Or, you could read up at www.safespeed.org.uk/rttm


Top
 Profile Send private message  
 
 Post subject:
PostPosted: Sun Nov 05, 2006 15:56 
Offline
User

Joined: Tue Oct 10, 2006 22:57
Posts: 261
smeggy wrote:
**Mike** wrote:
I have book marked this link and good god he’s a genius, even takes a poke at Safe Speed.

http://www.ex-parrot.com/~chris/wwwitte ... ument.html

In case you are wondering what all the RTTM hubbub is about, this explanation is from the same website:

http://ex-parrot.com/~pete/notverygoodatstatistics.html
(let's not forget he "likes speed cameras" )

Or, you could read up at www.safespeed.org.uk/rttm


I’m not going to attempt to go through every link, as you could post a hundred that said the opposite. (Possibly) it’s mostly speculation and scaremongering on BOTH sides.

It would appear one of Safe Speeds main arguments is that road deaths were on a decrease when the cameras were introduced around 1993. is this correct??

The argument that they are all for revenue is flawed as they know paint them indigo and high viz, they broadcast where they are sited and the mobile laser sites….

In there words, “a decrees of tickets issued is a good thing, it shows they’re working”
(HA)

They have rather expensive equipment that do not issue fines but warn motorists they are speeding, as another link mentions, not revenue, but for safety.

For every con there is a pro, in my opinion.


However, my last link showed in technical detail that the arguments mentioned above are flawed.

I’m not going to repeat what he said, as he said it a thousand times better than I ever could.
But it’s a valid point that the number of cars on today’s roads, were significantly increased after 1990’s (recession).

Therefore, where is Safe Speeds diagrams/graphs that show, the number of cars, miles of road (inc new roads), driver trends, accidents, injuries and deaths????

Safe Speeds, graphs were designed to have the required results.


Top
 Profile Send private message  
 
 Post subject:
PostPosted: Sun Nov 05, 2006 16:17 
Offline
Member
Member

Joined: Thu Dec 29, 2005 00:31
Posts: 393
http://www.ex-parrot.com/~chris/wwwitte ... ument.html

"Clearly, the number of road casualties in any given year is the result of a random process. By saying that there is a `trend', we are claiming that the number of deaths in a given year is given by some smooth function which changes slightly year-on-year -- the trend -- plus some random variable, a `residual'. Here are some possible models:"

If they are random and variable, It won't make must difference what speed you do, or where you do it. That is obviously nonsense, a fifty year trend of reducing casualties by education and engineering stops, when revenue generating enforcement replaces education.

"Some smooth function which changes slightly year-on-year."
Like Education, vehicle safety (ABS, EBD, airbags front and side, traction control, chassis design, NCAP stars etc. All during the cameras lifetime) and Highway Engineering improvements.

The civilian operator arguement is likely to be Appealed all the way to Europe if necessary.

I note your link mentions the right to silence, O'Halloran and Francis's case is at present being considered by the Grand Council (the highest Authority) of the European Court of Human Rights.

fatboytim


Top
 Profile Send private message  
 
 Post subject:
PostPosted: Sun Nov 05, 2006 16:28 
Offline
User

Joined: Tue Oct 10, 2006 22:57
Posts: 261
So Tim, are you saying that the stretches of road, the cameras cover have not seen significant drops in the number of accidents, injuries and fatalities?


Top
 Profile Send private message  
 
 Post subject:
PostPosted: Sun Nov 05, 2006 16:30 
Offline
User

Joined: Tue Oct 10, 2006 22:57
Posts: 261
I’m not saying I’m right and you lot are wrong, I’m saying you cannot state they have not improved things with the graphs and stats on this site


Again, the graphs and flow charts on this site are designed to give the required result.

I think it’s a ridicules claim (and an untested claim) to suggest the speed has nothing to do with random accidents is just unjustified, where and how can this be proven?


Top
 Profile Send private message  
 
 Post subject:
PostPosted: Sun Nov 05, 2006 16:43 
Offline
Site Admin
User avatar

Joined: Sat Mar 06, 2004 06:46
Posts: 16903
Location: Safe Speed
**Mike** wrote:
Safe Speeds, graphs were designed to have the required results.


That's insulting and it's false.

What makes you think we have a 'desired result' at all?

That's not the way this thing came about. I thought speed cameras were 'bad justice'. So I set up a web site in 2001 expecting it to be a hobby. In order to populate the website I looked into the government case. After more than 18 months of that I was so absolutely horrified at what I found that I gave up work to run the campaign full time. There's no money in it. But there are thousands of lives to be saved by aligning policy with the way that road safety really works.

_________________
Paul Smith
Our scrap speed cameras petition got over 28,000 sigs
The Safe Speed campaign demands a return to intelligent road safety


Top
 Profile Send private message  
 
 Post subject:
PostPosted: Sun Nov 05, 2006 16:53 
Offline
User

Joined: Tue Oct 10, 2006 22:57
Posts: 261
SafeSpeed wrote:
There's no money in it. But there are thousands of lives to be saved by aligning policy with the way that road safety really works.


So where are your statistics that show, “doing away” with speed cameras will save lives?

Sorry if you feel it is insulting, it’s only meant to suggest that you can design a graph to show whatever results if the input doesn’t count/measure everything.

As this link below shows.

http://www.ex-parrot.com/~chris/wwwitte ... ument.html


Top
 Profile Send private message  
 
 Post subject:
PostPosted: Sun Nov 05, 2006 16:56 
Offline
Friend of Safe Speed
User avatar

Joined: Sun Sep 25, 2005 10:16
Posts: 7986
Location: Moved to London
**Mike** wrote:
smeggy wrote:
In case you are wondering what all the RTTM hubbub is about, this explanation is from the same website:

http://ex-parrot.com/~pete/notverygoodatstatistics.html
(let's not forget he "likes speed cameras" )

Or, you could read up at www.safespeed.org.uk/rttm


I’m not going to attempt to go through every link, as you could post a hundred that said the opposite. (Possibly) it’s mostly speculation and scaremongering on BOTH sides.

I went though all ten of yours; the least you could do, if you genuinely want to engage in debate, is to at least look at the two of mine.

There is no speculation surrounding RTTM


Top
 Profile Send private message  
 
 Post subject:
PostPosted: Sun Nov 05, 2006 17:09 
Offline
User

Joined: Tue Oct 10, 2006 22:57
Posts: 261
I have read the RTTM post, it is a valid argument.

I just cant see any of Safe Speeds Graphs that consider the fact that recession ended in early 1990’s, there have been a considerable increase in cars on the roads, higher usage and dependency on motor vehicles, number of deaths, accident, car collisions, near misses are not all taken in to consideration in ANY of Safe Speeds stats.

Perhaps I am wrong and you can show me the link to the Graph/stats I missed.


Top
 Profile Send private message  
 
 Post subject:
PostPosted: Sun Nov 05, 2006 17:17 
Offline
Friend of Safe Speed

Joined: Sat Mar 06, 2004 12:01
Posts: 4813
Location: Essex
Quote:
I just cant see any of Safe Speeds Graphs that consider the fact that recession ended in early 1990’s, there have been a considerable increase in cars on the roads, higher usage


This is taken into consideration for the most part by analysing per vehicle mile - which is what's done on here.


Top
 Profile Send private message  
 
 Post subject:
PostPosted: Sun Nov 05, 2006 17:40 
Offline
Friend of Safe Speed
User avatar

Joined: Sun Sep 25, 2005 10:16
Posts: 7986
Location: Moved to London
**Mike** wrote:
I have read the RTTM post, it is a valid argument.

Excellent. I'm glad to see you understand it.

**Mike** wrote:
I just cant see any of Safe Speeds Graphs that consider the fact that recession ended in early 1990’s, there have been a considerable increase in cars on the roads, higher usage and dependency on motor vehicles,

This has always been the case, even since well before 1992 - during which there was a very nice negative trend with time.

**Mike** wrote:
number of deaths, accident, car collisions, near misses are not all taken in to consideration in ANY of Safe Speeds stats.

Near misses are not reported. Speed camera effectiveness is measured by fatalities and KSIs. There are plenty of graphs showing these. Start hereand hover over ‘Understanding’.

The graphs need updating, but the fatality rate has hardly fallen over the last few years (less than 1% last year).


Top
 Profile Send private message  
 
 Post subject:
PostPosted: Sun Nov 05, 2006 17:55 
Offline
User

Joined: Tue Oct 10, 2006 22:57
Posts: 261
Quote:

The way to do this is to formulate the theory in terms of a hypothesis which can be tested, then test it.

The hypothesis is that, up to 1993, there was a falling `trend' in road casualties; and after 1993, this `trend' slowed. 1993 is important here because it was the year in which speed cameras were first introduced. (It was also -- coincidentally -- the year when the amount of traffic on the roads began rapidly to increase after a hiatus during the recession of the early 1990s. Make of this what you will. In any case to do this properly the analyst would have to show that 1993 was a significant year; but here we're only testing previous claims, so we skip that step.)

Clearly, the number of road casualties in any given year is the result of a random process. By saying that there is a `trend', we are claiming that the number of deaths in a given year is given by some smooth function which changes slightly year-on-year -- the trend -- plus some random variable, a `residual'. Here are some possible models:

Linear trend:
we assume that the mean number of deaths in any given year is some constant fewer than the mean number in the preceding year. Obviously this model is wrong at some point, since the number of deaths must be positive or zero; but for a short interval this may be a valid model:
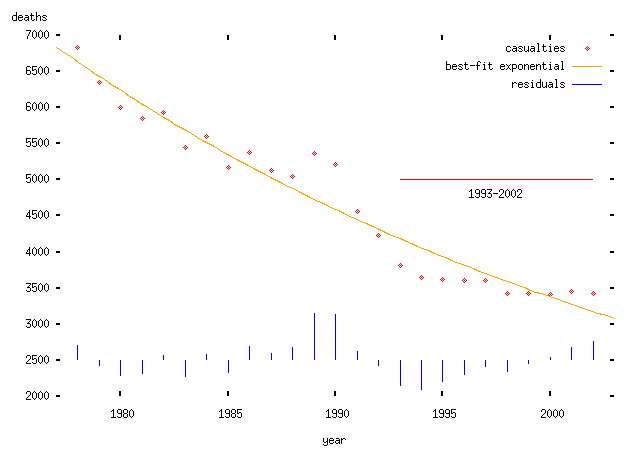
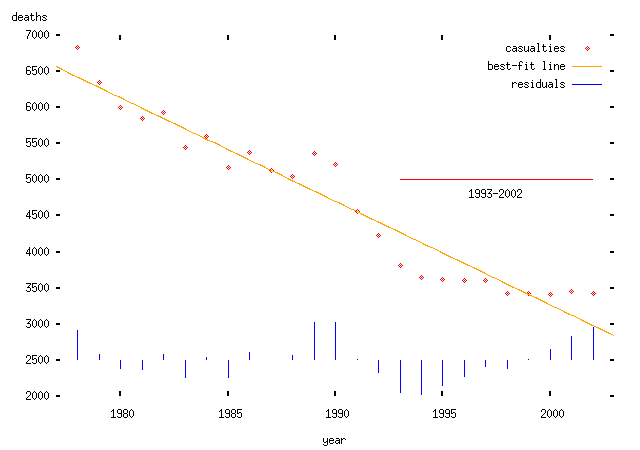
Image

Exponential model: we assume that the mean number of deaths in any given year is some constant fraction less than the mean number in the preceding year. This has the nice property that it can never be negative.

Image

(Note that I haven't justified why there should be a downward trend or why it should be linear or exponential. If I wanted to make some kind of positive prediction, I would need to do so; in particular, I would need a model of why this should happen. But I don't need to do that here, since I'm interested in analysing somebody else's claim, which itself assumes a particular trend. To do anything useful with this kind of trend, you really need a theory which explains why there should be a trend and what form it takes. There's also the issue of how you find the trend. In the ABD's case, they appear to have chosen the trend line which is most favourable to their theory; in the plots above I have used the conventional procedure: to find the best fitting curve or line using a least-squares procedure. The two models fit about equally well, but that's not really relevant since we haven't explained why we would expect such a trend in the first place. I should say that I do believe that there is a trend -- but I can't explain exactly why there is a trend. I expect that it relates to increasing road and vehicle safety, though there are other possibilities.)
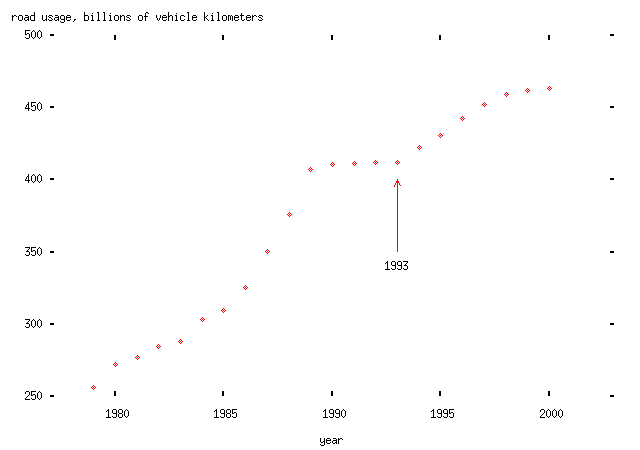
Another theory which is also popular, and which I'm also not going to try to justify, is that road casualties depend linearly on the amount of road traffic -- measured in vehicle kilometers, so that two movements of one kilometer by different vehicles counts the same as one movement of two kilometers by one vehicle -- and fall according to some trend. (This theory is obviously partly sensible -- increasing road usage will, presumably, lead to more accidents -- but the assertion about linear dependence would need to be tested for this theory to be very useful. In particular, a nonlinear dependence would be easier to justify, since motorists often crash into one another rather than into stationary objects, and the rate at which that occurred would presumably depend upon the square of the number of vehicle kilometers driven.)
Anyway, here's the rate of road usage in vehicle kilometers on Britain's roads from 1993 to 2000 (note the increase starting after 1993):
Image

... and here's the plot of deaths per vehicle kilometer driven with an exponentially-falling trend:
Image

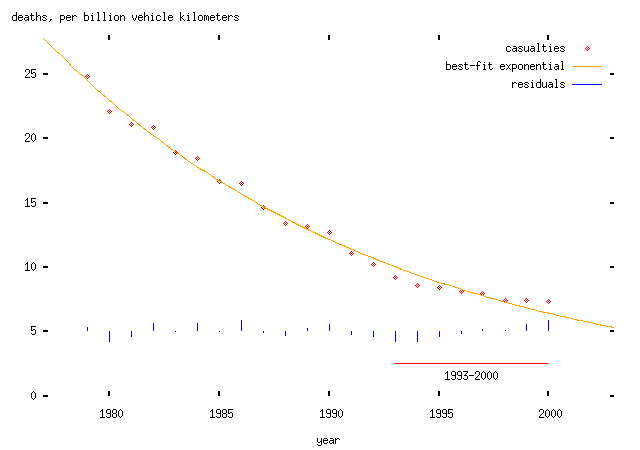
(Superficially, I'll remark that this looks pretty good. But that doesn't necessarily mean anything much.)
Now we want to ask whether these `trends' changed after 1993. We can't do this just by looking at the plots, because a pattern that appears to be obvious to the eye might just be coincidental. Instead, we need to do some kind of formal test to find out whether the `trend' has changed.
If the trend had indeed changed, the residuals after 1993 would be distributed differently from those before 1993. Either the variance -- i.e., the spread -- of the residuals would increase; or, more interestingly, the mean of the residuals would change. In English, that means that the trend would consistently under- or overestimate the actual number of deaths. (The anti-speed-camera people would like to say that the trend has underestimated the number of deaths, and interpret this as evidence that some change -- speed cameras -- `caused' the extra deaths.)
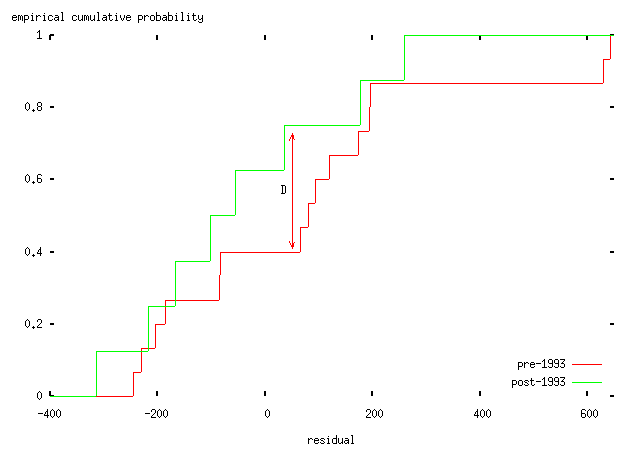
A standard technique to answer this question is a Kolmogorov-Smirnov test (like everything in statistics, it's named after its inventors); this test can be used to tell us whether two sets of samples -- in this case, the pre- and post-1993 residuals from the various models -- are either (a) drawn from different distributions; or (b) are consistent with having been drawn from the same distribution. The idea of this test is that we take the two cumulative distributions and plot them on the same axes, and then find the furthest distance between the two curves. This maximum distance (called the `Kolmogorov-Smirnov test statistic') can then be compared to a critical value which tells us whether the two sets of samples were drawn from different distributions or not. (Surprisingly enough given my description, this is actually formally correct and backed up by all sorts of hideous maths.) Here's an illustration with the residuals for the exponential case above:

Image

Pleasingly, those nice people at the R Project have implemented software which will do almost all of the work for us. So:
Model K-S statistic p-value Conclusion
linear, total deaths 0.1806 0.9718 same distribution
exponential, total deaths 0.3403 0.4059 same distribution
exponential, deaths per vehicle kilometer 0.1714 0.9943 same distribution
-- that is, in each case, there is no evidence that the trend is any worse a fit after 1993 than before. None of these data support the hypothesis that there was a change in trend in road casualties in 1993, measured either in total or per vehicle kilometer.
This doesn't, of course, tell us anything new about speed cameras, or whether they are good or bad for safety. It tells us that one argument used against them -- by the ABD, and Idris Francis and other assorted loons from the `Safe Speed' campaign -- is bull.


Top
 Profile Send private message  
 
 Post subject:
PostPosted: Sun Nov 05, 2006 18:08 
Offline
Friend of Safe Speed
User avatar

Joined: Sun Sep 25, 2005 10:16
Posts: 7986
Location: Moved to London
Mike, there's no point in posting the whole page, just copy/paste and highlight the parts you feel relevant.


I notice some of those 'more telling' graphs conveniently end at year 2000..... :scratchchin:


Top
 Profile Send private message  
 
 Post subject:
PostPosted: Sun Nov 05, 2006 21:00 
Offline
Member
Member

Joined: Thu Dec 29, 2005 00:31
Posts: 393
Mike,

"So Tim, are you saying that the stretches of road, the cameras cover have not seen significant drops in the number of accidents, injuries and fatalities?"

I don't know on a case by case basis, but if there are any accidents or prosecutions on that stretch of road it shows they are not really working at educating people as to the speed required.
There is one Police Force that does not use cameras, and much to ACPO's embarassment it appears to be making its roads the safest in the country (it also seems to support the Safespeed arguemnet)

The anomaly is, although the number of vehicles may have started to increase in 1993, so did the fitting of the safety devises I mentioned earlier, and coupled with the introduction of safety cameras surely we should have seen a massive drop in casualties.

If we look at the last 5 years, where cameras have reached a peak (for now) and hundred of thousands of prosecutions have been issued, road deaths have not dropped dramatically.

I have lived in Hongkong, and the roads are properly policed, if a cop sees you turn without indicating, blown bulb or unecessary fog lights you will get pulled, a ticket is unlikely but the hassle from the stop and check acts as a great aide memoir.
The roads seemed safer though more congested, then again jay walking was an offence, so pedestrians were a little more predictable, the local driving test requires an off the highway test (like our CBT for bikes) before being allowed on the road as a learner.

It seemed remarkably safe considering the density of population.

Over the border in China was a different story.


fatboytim


Top
 Profile Send private message  
 
 Post subject:
PostPosted: Sun Nov 05, 2006 22:59 
Offline
User

Joined: Tue Oct 10, 2006 22:57
Posts: 261
smeggy wrote:
Mike, there's no point in posting the whole page, just copy/paste and highlight the parts you feel relevant.


I notice some of those 'more telling' graphs conveniently end at year 2000..... :scratchchin:


The point of posting all the graphs was to show you can have results stating the opposite to what you Safe Speeds graphs/stats show.

I’m not by any means saying they are defiantly saving many lives, although the many links I posted would suggest that, I’m just stating that the example above the Graphs on Safe Speed are not accurate, how could they be?

Whether you agree or disagree, it’s hard to prove it would be safer without them, I certainly know many people who reduce speed when they know a camera’s around the corner and the stopping distance at 30mph is statistically proven to be shorter than the stopping distance at 34/40mph. and that’s a fact and one that could save a life.


A simply way of looking at it, without going to the extent of my link of Ex-Parrots graphs and Safe Speeds graphs, is this:

Are there fewer collisions/accident/fatalities since the implementation of these speeding cameras on the stretch of roads they cover?

I put it to you that (in simple terms) they have reduced accidents, injuries and fatalities.

I’m sure a ton of people will respond by saying how can you calculate a random figure like an accident…. Well how can YOU calculate and form Stats on a random figure.

All I know is there ARE fewer accidents in the previously dangerous and problematic stretches of road, when you take in to consideration the increase in cars on the roads and use of them, these figures are available for all to see on many websites and news clippings. (who’s to say if it’s down to speed cameras, new ABS brakes or just randomness ect)

However, there is no way of disproving this, no matter how much you all try.
And really, no offence to the hard work many of you do when helping motorists with driving convictions/fines etc BUT you are never going to get the Gov to get rid of these initiatives, they are paying for themselves, yes and creating revenue, but more importantly, they appear (from there stats) to be working in reducing the number of accidents, look at it anyway you want, there is no other way of getting the results they have over the last ten years.

Can anyone tell me how many cars there are now and haw many there were in 1990? 1993? And there are fewer deaths now then?? Surely there doing something right..

Again, no matter how many people gather together on websites like this, it’s never going to get rid of the speed reduction initiatives, you may as well go and make ships in bottles.
You’ll get a better outcome with the time you put in.

Lastly and at the risk of repeating myself,

When were talking about a stretch of road that had around 21 deaths over three years before the cameras were installed and then just one for the two years after.

I know how I’m basing my opinion.

“Preliminary results from an independent evaluation of 28 speed camera sites found deaths have been reduced from 21 (over the three years leading up to camera installation) to 1 (in two years with the cameras operating).
NSW fixed speed camera program evaluation”

http://www.rta.nsw.gov.au/roadsafety/sp ... dents.html
http://news.bbc.co.uk/1/hi/uk/3807325.stm
I could be here for hours posting links that you’ll never read.


Top
 Profile Send private message  
 
 Post subject:
PostPosted: Sun Nov 05, 2006 23:07 
Offline
User

Joined: Tue Oct 10, 2006 22:57
Posts: 261
Here is the experience and opinion of a Police Officer, who has dealt with speeding motorists, a very good one at that.

http://www.ciao.co.uk/Speed_Cameras__Review_5281747

“Speed limits and traffic calming measures, although annoying, are there for a reason. It has nothing to do with how good a driver you are, the fact is that if you drive even 5mph over the limit in a 30mph zone then the braking distance is considerably more. Children, the elderly and other vulnerable people cannot legislate for the fact that you're late for work/are applying your make-up/changing the radio station/having a laugh with your mate on the mobile. They will still run across the road to fetch their ball, run after a ice cream van, fetch their dog or for any other reason that these people become nothing more that statistics after they're fatally run over.

I have read some opinions where people argue that if the speed limits weren't there then people would use their common sense when it came to driving at speed when, for example, children were on their way to or back from school. This is nonsense as I have been on traffic patrol specifically targeting areas near schools and the results are frightening. Often the worst offenders are the parents who are late dropping their kids off and then are late themselves for work.”


Top
 Profile Send private message  
 
Display posts from previous:  Sort by  
Post new topic Reply to topic  [ 48 posts ]  Go to page 1, 2, 3  Next

All times are UTC [ DST ]


Who is online

Users browsing this forum: No registered users and 19 guests


You cannot post new topics in this forum
You cannot reply to topics in this forum
You cannot edit your posts in this forum
You cannot delete your posts in this forum
You can post attachments in this forum

Search for:
Jump to:  
Powered by phpBB® Forum Software © phpBB Group
[ Time : 0.025s | 11 Queries | GZIP : Off ]